How really is the Gandhipuram flyover helps reduce traffic congestion
Introduction
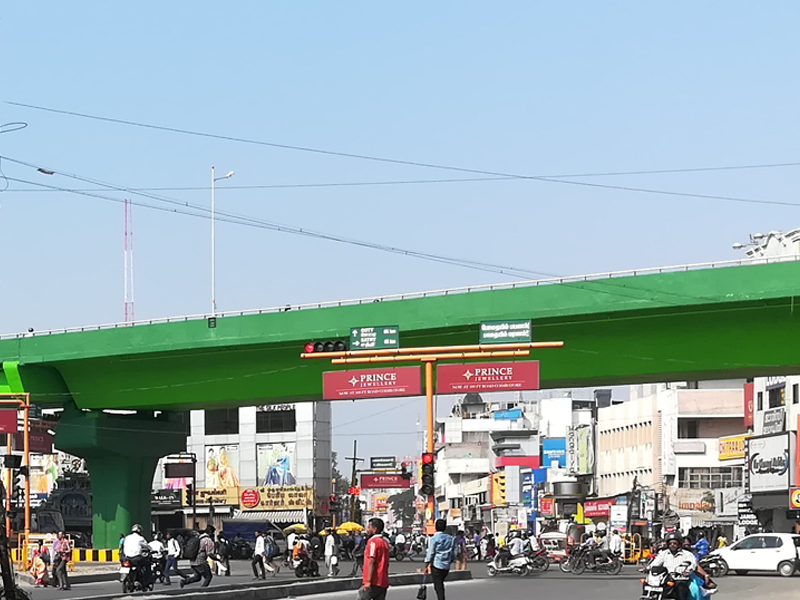
After a long wait, the much awaited Gandhipuram flyover was opened for traffic on 1st November, 2017. There has been speculations that the change in design would bring down the utilisation of the flyover. As it has been put into use for more than 10 days, I have made a small study on how the traffic pattern has been changed with the Gandhipuram flyover put into use and what percentage of traffic uses the flyover at a weekday peak-hour.
From this study, we can conclude on the following metrics:
- What percentage of vehicle actually uses the Gandhipuram flyover
- What type of vehicle gets benefited the most
- Traffic distribution by size
- Traffic distribution by total number of people
- Traffic distribution by total number of people
- How faster you can move on the flyover in comparison to ground level
- How the utilisation can be improved for a long-term
Disclaimer
The data used for the study is comparitively small and the results may not reflect the overall usage of the flyover.
Data used for study
For the study, a small sampling has been recorded on Friday (10th November 2017), considering it as a weekday peak-hour sample. All the data mentioned in the article were recorded between 9:00am to 9:30am. Vehicle movement has been recorded in Park Gate towards North and in Textool (Lakshmipuram stop) towards South. In both the directions the sample data is spread over two minutes each.
| Vehicle Type | Park Gate (Towards North) | Textool (Towards South) | ||||
|---|---|---|---|---|---|---|
| Service Lane | Flyover | Total | Service Lane | Flyover | Total | |
| Two Wheeler | 85 | 47 | 132 | 93 | 54 | 147 |
| Car | 22 | 8 | 30 | 14 | 20 | 34 |
| Auto | 4 | 1 | 5 | 3 | 0 | 3 |
| Mini-Truck | 5 | 1 | 6 | 0 | 4 | 4 |
| Van | 0 | 1 | 1 | 0 | 0 | 0 |
| Tempo | 3 | 0 | 3 | 0 | 0 | 0 |
| Bus | 8 | 0 | 8 | 1 | 0 | 1 |
Utilisation of flyover
By number of vehicles
In the basis of number of vehicles, the total number of vehicles proceeded towards north is 185, out of which 127 took the service road and 58 took the flyover. This results in around 31.35% vehicles travelling towards north take the flyover. The total number of vehicles proceeded towards south is 189, out of which 111 took the service road and 78 took the flyover. This results in around 41.26% vehicles travelling towards south take the flyover.
Overall, out of the total vehicles 36% took the flyover while the rest took service road.
By size of traffic
The traffic congestion can be directly dependent on the size of vehicular movement. For eg, one bus can make more congestion than a couple of two wheelers. So converting the number of vehicles to the size units as below.
| Vehicle Type | Two Wheeler | Car | Auto | Mini-Truck | Van | Tempo | Bus |
|---|---|---|---|---|---|---|---|
| Size Units | 1 | 3 | 2 | 3 | 6 | 6 | 10 |
The data results in the following table based on its size.
| Vehicle Type | Park Gate (Towards North) | Textool (Towards South) | ||||
|---|---|---|---|---|---|---|
| Service Lane | Flyover | Total | Service Lane | Flyover | Total | |
| Two Wheeler | 85 | 47 | 132 | 93 | 54 | 147 |
| Car | 66 | 24 | 90 | 42 | 60 | 102 |
| Auto | 8 | 2 | 10 | 6 | 0 | 6 |
| Mini-Truck | 15 | 3 | 18 | 0 | 12 | 12 |
| Van | 0 | 6 | 6 | 0 | 0 | 0 |
| Tempo | 18 | 0 | 18 | 0 | 0 | 0 |
| Bus | 80 | 0 | 80 | 10 | 0 | 10 |
In the basis of size of vehicles, the total volume of vehicles proceeded towards north is 354, out of which 272 took the service road and 82 took the flyover. This results in around 23.16% vehicles travelling towards north take the flyover. The total volume of vehicles proceeded towards south is 277, out of which 151 took the service road and 126 took the flyover. This results in around 45.48% vehicles travelling towards south take the flyover.
Overall, out of the total volume of vehicles 33% took the flyover while the rest took service road.
By number of people
Calculating the utilisation based on the number of people (by capacity of the vehicle) will throw light on what percentage of people got benefitted by the Gandhipuram flyover.
| Vehicle Type | Two Wheeler | Car | Auto | Mini-Truck | Van | Tempo | Bus |
|---|---|---|---|---|---|---|---|
| Passenger capacity | 2 | 5 | 3 | 2 | 20 | 3 | 50 |
The data results in the following table based on passenger capacity.
| Vehicle Type | Park Gate (Towards North) | Textool (Towards South) | ||||
|---|---|---|---|---|---|---|
| Service Lane | Flyover | Total | Service Lane | Flyover | Total | |
| Two Wheeler | 170 | 94 | 264 | 186 | 108 | 294 |
| Car | 110 | 40 | 150 | 70 | 100 | 170 |
| Auto | 12 | 3 | 15 | 9 | 0 | 9 |
| Mini-Truck | 10 | 2 | 12 | 0 | 8 | 8 |
| Van | 0 | 20 | 20 | 0 | 0 | 0 |
| Tempo | 9 | 0 | 9 | 0 | 0 | 0 |
| Bus | 400 | 0 | 400 | 50 | 0 | 50 |
In the basis of people movement, the total passenger capacity proceeded towards north is 870, out of which 711 took the service road and 159 took the flyover. This results in around 18.27% people travelling towards north take the flyover. The total passenger capacity proceeded towards south is 531, out of which 315 took the service road and 216 took the flyover. This results in around 40.67% people travelling towards south take the flyover.
Overall, out of the total passenger capacity 27% took the flyover while the rest took service road.
It is Cars, that are benefited the most
Among the type of vehicles, Cars followed by Two wheelers have migrated from the regular traffic to the flyover. By percentage Van and Mini-Truck have more, but by their total number they are negligible.
How faster is the flyover?
On a average two-wheeler drive, the vehicle driving on the flyover is almost 100% faster than the vehicle moving in the service lane traffic.
- Toward north in service lane took 240 seconds
- Toward north in flyover took 125 seconds
- Toward south in service lane took 255 seconds
- Toward south in flyover took 135 seconds
How to improve the utilisation of Gandhipuram flyover?
Though the analysis have been made only on the Level-1 of the flyover and having Level-2 under construction, there is no common traffic across the two levels so this study can be taken as a base for improvements. It is to be welcomed that the government is ready to hear suggestions from people to make modifications to the flyover, so that its utilisation can be improved much better.
Based on the above numbers, it looks like the flyover is much useful for people who come down south from Ganapathy towards Nanjappa Road as nearly 40-45% of vehicles use the flyover. But the utilisation has to be increased towards north.
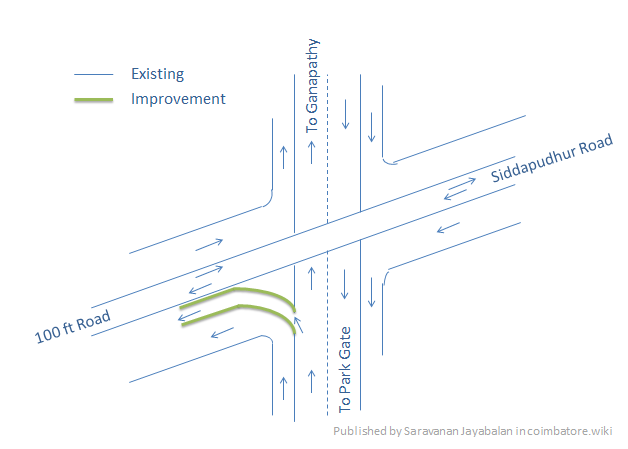
Improvement #1: An arm landing towards 100ft road
A branch can be taken out from the Level-1 (left side while driving towards Ganapathy) to join the 100ft in the ground level towards west. This will help people travelling from Trichy Road, Avinashi Road and south of the city to join Mettupalayam Road. Also this will reduce traffic in cross-cut road signal. This arm can be adjacent to Level-2 flyover in order to avoid land constraint.
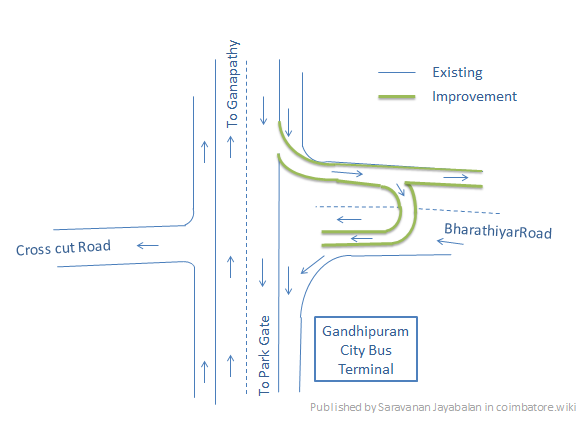
Improvement #2: An arm landing towards Bharathiyar road
A branch can be taken out from the Level-1 (left side while driving towards Park Gate) to join the Bharathiyar in the ground level towards east. This will help people travelling from Sathy Road to join Avinashi Road. And there can be a U-turn in Level-1 that joins the traffic from Bharathiar road towards cross-cut signal. This will be helpful for people from Sathy road to reach cross-cut and North Coimbatore flyover. This modification is easy as both sides of Bharathiyar road near the junction belongs to the government.
Improvement #3: Move central bus stand out of city core
What? Yes, the service lane traffic can be eased by removing the inter-city busses. As there are plans to construct Integrated Bus Station in Vellalore, we have to keep our fingers crossed.
Improvement #4: Organise city bus traffic
City busses moving in and out of the City bus terminal causes traffic congestion, dedicated lanes can be made (atleast from cross-cut signal to central bus stand) will make the traffic flow organised.
Improvement #5: A (sub)way for pedestrian crossing
Hundreds of passengers cross the Nanjappa road between the flyover every minute. More than improving traffic, safety of these pedestrian comes to the top priority. A subway or a pedestrian overpass with escalator facilities is a must and top priority item.
Conclusion
Though the flyover conversion rate is lower in the Park Gate site, it can be improved by above suggested methods. The entry point to the service lane near Park gate should be widened as it is too narrow considering the ratio of vehicles it carries.
The utilisation of the Gandhipuram flyover by the traffic from Sathy road is impressive. Apart from the regular traffic the flyover has brought in new traffic who were previously using Avarampalayam road to reach Avinashi road and then to Trichy road. This also reduces traffic a little in the Avarampalayam road, Ramakrishna Hospital junction section.
Apart from this blog post, I am planning to take this study along with the improvements (even if you have some) to the concerned authorities.
Kindly post your feedback as comments, even if you have any idea to make modification to the flyover and improve the traffic pattern please post them.
Suggestions
I wish to welcome suggestions / ideas on what can be included in this website to make this more useful to people and also to make this site a one-stop portal for all information regarding Coimbatore. You can mail your suggestions to contact@way2cbe.com